


Source: Prydatko V., Shtepa Yu., Ischuk A. and Petrochenko O. Areas of high diversity with threatened species/BINU Ukraine Project Extract: National ‘State of Ecosystem’ Report (Agrobiodiversity)…IFS Examples/Agrobiodiversity of Ukraine: Theory, Methodology, Indicators, Examples. Book 2 (Ukr). Kyiv: ‘Nichlava’. 2005.- pp.576-579 (Eng). Use and interpretation Users and key questions for which the indicator is intended (if appropriate, comment on whether it is a pressure, state or response indicator, recognizing that one indicator may fill several roles in this respect) Potential users of this indicator include authorized bodies of executive power on ecology and natural resources, the National Commission on the Red Data Book of Ukraine, hunting and fish management institutions and their local representatives, local state administrations; the beneficiary and the recipients of the UNEP-GEF Biodiversity Indicators for National Use (BINU) Project, educational institutions where ecology is studied, etc. The indicator helps answer the following key questions: “What lands could be returned to a natural state in the near future?”, “What are the main factors that cause agrobiodiversity loss or increase, and how do the changes in land use practices influence agrobiodiversity loss or increase?”, and “How can scenarios of agrobiodiversity change be created and how can biodiversity loss be stopped in the near future?” The indicator refers to the indicators of state (S) and response (R). 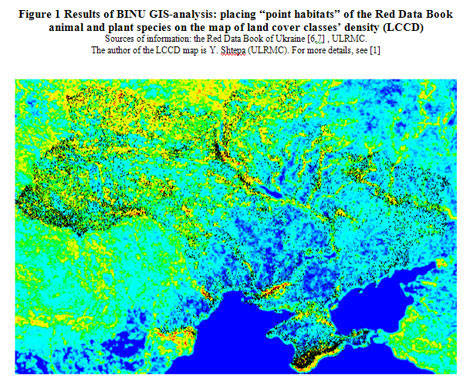 Scale of appropriate use and potential for aggregation The entire territory of Ukraine, as well as oblasts, districts, natural and agricultural zones, etc. Meaning and potential causes of upward and downward trends Theoretically, the less identified “hot spot” territories, the better the state of biodiversity (agrobiodiversity) is. GIS and a modern map of agro-landscapes of Ukraine were used with the help of RS data to combine “point” habitats of the Red Data Book listed species with agricultural surfaces [1]. According to these updated data, up to 45% of the Red Data Book listed plant habitats and 47% of animal habitats (profiles of which can be found in 1994-1996 issues of the Red Data Book of Ukraine) intersect with today’s active agricultural surfaces – see Annex 1. At the same time, nowadays, it is still difficult to say how the situation changes for several reasons. Some publications say that the number of Red Data Book listed species in Ukraine will continue to increase – see our materials concerning the indicator Antropogenic Pressure Value: The Red Data Book Species Response to the Antropogenic Pressure (or RDB-Response Index)[2]. At the same time, there are a number of state programs that may improve the situation (i.e. ecological network development programs, land conservation programs, etc.). These approaches will ensure better planning of nature protection measures related to agro-landscapes as well as provide modern mapping.
  Implications for biodiversity management This topic is constantly being discussed and studied in Ukraine. The critical question is how to work with these “hot” territories on a regular basis and to indicate them on the map effectively. The BINU Project for the first time used remote sensing data to develop a relevant thematic map [1,3]. The indicator and its presentation in the form of a map will, certainly, be further taken into account while implementing the Concept for Perspectives of Use, Conservation and Reproduction of Agrobiodiversity in Ukraine. The main provisions of this Concept were published in 2003 [4]. The given indicator is not included into the list of indicators compiled by the Subsidiary Body on Scientific-Technical and Technological Assistance (SBSTTA) within the Convention on Biological Diversity (CBD). However, many countries use it to provide information about habitats of threatened species [5].
 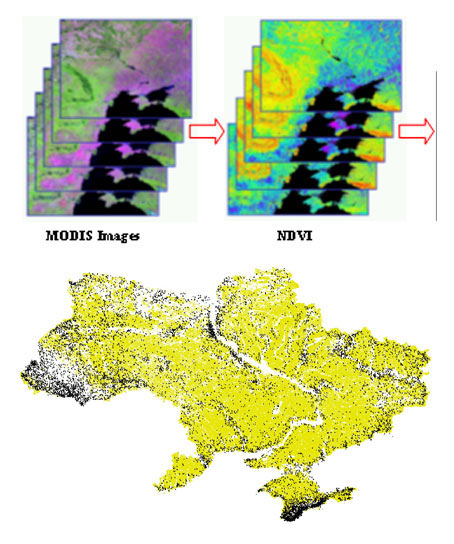 Units in which it is expressed (for example, km2, number of individuals, % change) In our case, a thematic map generated with the help of GIS was used to generalize the information. Here, an ArcMap option called “completely contain” was applied to identify the groups of “point” objects within the polygonal object. As shown above, the unit of measurement, in this case, can be a fraction and/or percentage of species or their “point” habitats, depending on the choice of the l user. Description of source data (origins, units, sample size and extent, custodians) The indicator is developed using data from the Red Data Book of Ukraine, other scientific publications, the annual state statistical reporting (Form 1- reserve), and modern RS and GIS materials. Calculation procedure (including appropriate methods and constraints for aggregation) GIS methods were applied, and a modern map of agro-landscapes of Ukraine was generated with the help of RS data [1]. Such approach was first initiated by the BINU Project [1,3]. Most effective forms of presentation (graph types, maps, narratives, etc. – give examples if possible)
  See Figure 1 and Annex 1. Data source and process for updating The indicator is developed with data from the Red Data Book of Ukraine, other scientific publications, the annual state statistical reporting (Form 1- reserve), and modern RS and GIS materials. Closely related indicators These are the following indicators: Territories for Monitoring of Wild Species Associated with Agro-landscapes and Antropogenic Pressure Value: The Red Data Book Species Response to the Antropogenic Pressure (or RDB-Response Index). For more details, please see the BINU web-page at http://www.ulrmc.org.ua/services/binu/is/Board.asp?quest=2&TextName=〈=EN. Additional information and important comments The obtained examples were demonstrated to the participants of the conference Understanding the Linkages Between Poverty and Biodiversity, which was held in Ecuador on November 24-26, 2004, as well as to the participants of the 3rd Working Group Meeting of the BINU Project in Kyiv on December 17, 2004. Based on observations and combinations of maps, there was also found out that distribution of the given “point” habitats and density of land cover classes (LCC) are closely correlated: the habitats are more widely distributed in the western part of Ukraine, where the density of LCCD is greater (fig. 1). This important information can be further applied, for example, in mapping nature protection measures and designing elements of the ecological network of Ukraine. __ The compilers express sincere gratitude to everyone who at different times provided assistance to ULRMC in search and processing of various materials concerning “point” habitats of the Red Data Book of Ukraine species, including the information related to reserve territories. We are grateful to A. Grachov, O. Dudkin, A. Kozlova, Y. Sapiton, R. Burda, and many others. Additional sources of information 1. Созинов А.А., Штепа Ю.Н, Придатко В.И. Агросфера как объект целевого исследования с помощью ДЗЗ и ГИС для улучшения управления территориальным развитием и сохранения природного биоразнообразия / Ученые записки Таврического национального университета им. В.И.Вернадского, Серия «География», Том 17 (56), №2 (2004), с. 72-87 2. Буравльов та ін. Сила антропогенного тиску: відповідь червонокнижних видів на антропогенний тиск (або RDB-індекс)/Агробіорізноманіття України: теорія, методологія, індикатори, приклади. Книга 2. —Київ: ЗАТ “Нічлава”. 2005.-С.235-240. 3. BINU Ukraine National Report on Project Experience (2002-2004): Agro-biodiversity Indicators Development and Use. December 2004. v. 1. Kyiv (Prepared by Dr. Vasyl Prydatko and Yulia Apetova (ULRMC)). 4. Перспективи використання, збереження та відтворення агробіорізноманіття в Україні. (Відповідальні редактори акад. УААН, проф. Патика В.П., д.б.н., проф. Соломаха В.А.). Київ: “Хімджест”, 2003, 254 с. 5. Indicators and Environmental Impact Assessment. UNEP/CBD/SBSTTA/7/12, September 20, 2001. P.21. 6. Червона книга України: тваринний світ. К.: “Українська енциклопедія”, 1994, 457 с. 7. Червона книга України: рослинний світ. К.: “Українська енциклопедія”, 1996, 603 с. MSA-LCCD comparison (Adobe flash) [new window is required] Prepared by: G.Kolomytsev
0 Comments