


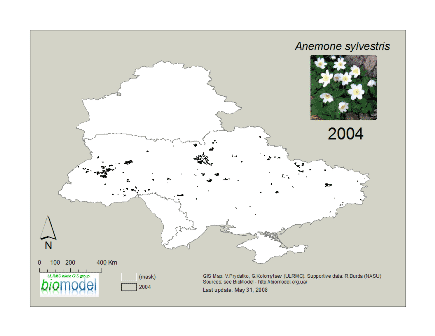
 Snowdrop anemone (Anemone sylvestris L.) areal changes were modelled with usage of historical, GIS and RS data, which included following. 1a) «Хорология флоры Украины (1986). 1b) «Екофлора України (2000-2004). 1c) Vegetation of European Part of the USSR: Analytical Maps I-IX (Attachments)/Vegetation of European Part of the USSR. S.P., Nauka, 1980.—429 pp, in Russian. 2) Atlas Florae Europaeae (1972-1996), edited by Jaakko Jalas and Juha Suominen, together with Raino Lampinen (Vol. 11)/Updated 2004-05-26 by Mikko Heikkinen – Website at http://www.fmnh.helsinki.fi/english/botany/afe/. 3) Ukraine Forest in 1990s based on Landsat Data (ULRMC, 2005). 4) Ukraine Vegetation of European Part of the USSR: Analytical Maps I-IX (Attachments)/Vegetation of European Part of the USSR. S.P., Nauka, 1980.—429 pp, in Russian. The historical map of 80s was scanned , processed and digitized in ArcGIS by V.Prydatko. Forest in 2000s based on Landsat Data (ULRMC, 2005). 4) Ukraine Forest Changes in 1990-2000 based on GIS Change Analyze (ULRMC, 2005). 5) Digital Forest Edges in Ukraine in 1990s and in 2000s (Prydatko et al., 2008). 6) Vegetation of European Part of the USSR: Analytical Maps I-IX (Attachments)/Vegetation of European Part of the USSR. S.P., Nauka, 1980.—429 pp, in Russian. The historical map of 80s was scanned , processed and digitized in ArcGIS by V.Prydatko. Map of the species habitats in 1980s is hypothetical, but which is based on the map of European natural steppe-meadow location. The data of Florae Europaeae [2] and Ecoregion [1c] was intersected in GIS environment with remote sensing data of 1990-2000 [3, 4]. The data and the MOVIE shows that natural habitats of A. sylvestris changed seriously during last 25 years, and it has new tendency of expansion to southern part of steppe natural zone (in GLOBIO Ukraine Region). The main causes of change are land use (increasing of forest edges due to forest fragmentation, changes of steppe-meadow condition), and possibly climate change. The example demonstrates a step to GLM-model. See full animated story about the trends GIS map authors: V.Prydatko (ULRMC), G.Kolomytsev (IZ NASU). Last update: May 30, 2008.
0 Comments