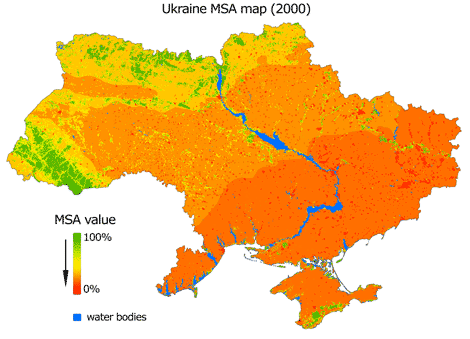
Final Mean Species Abundance map of the remaining biodiversity in Ukraine (2000):  Mean MSA value – 32.4% (0,324407296).Revised methodology was applied (by GIS modular with combined LU classes application; https://biomodel.info/?p=103). Final map image looks very similar to Landuse MSA. Obviously landuse is the dominant pressure causing the biodiversity loss process.
Categories: Bd Training Package


0 Comments