


 This BioModel-web section includes some separate description (examples) of species profiles, which reflects unique details and outcome of the modelling as well as other regional and local supportive details i.e. alternative scenarios. (Note: see more updated GLM-species-scenarios as for May 2009 here as well as modelling summary and/or data for downloads). The expected examples will take into account two key causes of change i.e. ‘land use’ [LU] and ‘climate change’ [CC]. Some previous regionally sound research have demonstrated that LU-pressure could be much more intensive contrary to that ‘CC-pressure’ or it would be a combination of these both factors. On the other hand that distribution shifts are more distinct on regional or global scale due to climate change. Proposed profiles will content respective examples and descriptions. For the EEBIO Project BioModel team produced and incorporated more local scientific data into updated ‘EcoProfile 2.1’ data base of MNP (RIVM). Now the package contents 167 species profiles including 90 new species that were entered during February-May (mammals – 27, vascular plants – 25, invertebrates – 12). Population trends were lighted in points (i.e. from 0 to 100) and in scope of the natural zones: Carpathian Mountainous, Crimea Mountainous, Ukrainian Steppe, Ukrainian Forest-Steppe and Polissya (Forest). The Project used diverse data was received from internal experts, scientific publications, web-pages. Accordingly the method of the data collection was titled as ‘expert’s evaluation’ or ‘official statistics’. The data quality – as the expert judgment limited or ‘official statistics’. Currently the data reflect different line of years for different species. For example: mammals (as well as many other species) – 1935, 1950, 1970, 1990, 2000, 2010. GLM-scenarios reflected 2030 and 2050 predictions. That EcoProfile data has supportive importance for the Project i.e. for development of alternative examples of predictions with usage of different approximation approaches (linear, logarithmic etc). There are two ‘alternative’ prediction examples for this threatened species White-Headed Duck – Oxyura leucocephala (Scopoli, 1769)
Example
The O.leucicephala natural habitat changes (1940-2001) are based on historical data. It was compared with changes of air temperature in the region in May in 1950’s and 1970’s. The envelope argues that: i) opinions of different experts and their errors move all together with the climate change trend, ii) O.leucocephala habitat locations were changed seriously under pressures of deffiren factors including that ‘climate change’.
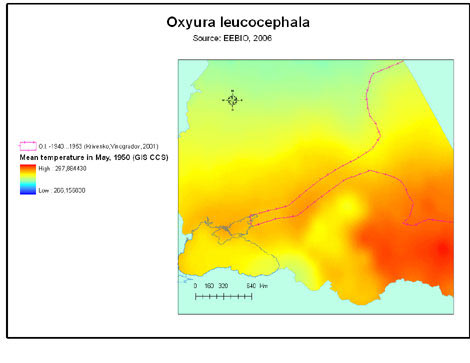 Authors of the overlap models: V.Prydatko, A.Ischuk, G.Kolomytsev. Kyiv: ULRMC, 2005, 2007. See more with pdf-map, pdf-map-2, and addressed GLM-scenarios for the species.
0 Comments