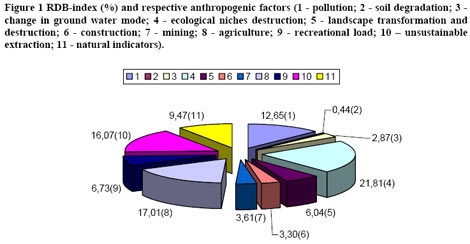
ANTROPOGENIC PRESSURE VALUE: THE RED DATA BOOK SPECIES RESPONSE TO THE ANTROPOGENIC PRESSURE (OR RDB-RESPONSE INDEX) Use and interpretation Users and the key questions for which the indicator is intended (if appropriate, comment on whether it is a pressure, state or response indicator, recognizing that one indicator may fill several roles in this respect) The indicator is introduced by the BINU project, and it is new for Ukraine. The authors consider that the users can be, in particular the Cabinet of Ministry of Ukraine, the Council of Ministers of the Autonomous Republic of Crimea, specially authorized bodies of executive power on ecology and natural resources; the National Commission on the Red Data Book of Ukraine; hunting and fish management institutions and their local representatives; local state administrations, other specially authorized bodies of executive power, according to their authority; the beneficiary and the recipients of the UNEP-GEF Biodiversity Indicators for National Use (BINU) project, academic institutions where ecology is taught, and other users. The key questions which this indicator helps to answer are: “What are the main factors that cause agro-biodiversity loss or increase, and how do changes in the land use influence upon agrobiodiversity loss or increase?” and “How can scenarios of agrobiodiversity changes be built, and how can biodiversity loss be stopped in the near future?” This indicator is referred to the group of indicators of pressures (P), and response (R). Scale of appropriate use and potential for aggregation The entire territory of Ukraine. (In fact it is the index of main categories of anthropogenic activity which is the cause of species transition to rare, threatened or endangered categories for their further inclusion into the Red Data Book of Ukraine (RDBU).) Meaning and potential causes of upward and downward trends The anthropogenic pressure influences upon stability of the ecosystem: while increasing the activity of a specific anthropogenic factor, respectively, these or other species are threatened or endangered within the area of the given influence; and while diminishing the impact and, respectively, improving the state of specific species populations, they can be removed from the Red Data Book of Ukraine. Numerous publications state that the number of the Red Data Book species in Ukraine will be increasing [1], therefore this index is critical. Implications for biodiversity management The use and ground of the index was initiated by the BINU project. The spur to this was the publication by one of the institutions-recipients of the BINU project – the Ukrainian Institute for Environment and Natural Resources (today it is the National Safety Institute) [2]. We hope that the RDB-index will be further considered while implementing the Concept Perspectives of Use, Conservation and Reproduction of Agrobiodiversity in Ukraine. The main provisions of this concept were published in 2003 [3]. The given index, for known reasons, is not included into the list compiled by the Subsidiary Body on Scientific-Technical and Technological Assistance (SBSTTA) within the Convention on Biological Diversity [4], but it can be foreseen that specialists will pay attention to it, as the RBD-index will help to assess the situation outside Ukraine as well. (In particular these are countries of the former USSR which use the same Red Data Book compiled by similar principles some time ago.) The algorithm of the recalculation of this index into another biodiversity indicator has not been developed yet, however, in fact, here we consider biodiversity within the context of the “red data book species”. The participants of the BINU workshops hold during 2002-2004 accepted that the indication of pressure upon wild agro-biodiversity is critical, and the Red Data Book of Ukraine species are related to this. Units in which it is expressed (for example, km2, number of individuals, % change) In our example – it is percentage (see the process of calculation). Description of source data (origins, units, sample size and extent, custodians) The source of information is the Red Data Book of Ukraine [5,6,7,8], and other respective materials of the state statistical reporting [9]. Calculation procedure (including appropriate methods and constraints for aggregation) The indicator is calculated on the basis of the RDB of Ukraine data as the correlation of the number of the “red data book species” from a specific group of anthropogenic activity to the total number of species included into the Red Data Book as a result of other types of anthropogenic activity. RDB-index developers proposed to determine the types of anthropogenic activity in accordance with the Leopold matrix approach [2]. Most effective forms of presentation (graph types, maps, narratives, etc. – give examples if possible) The example of the RDB-response index pie chart is provided in fig. 1. We believe that it is perspective to present the index change in space and time using thematic maps, especially as most of the described categories of anthropogenic impact are compatible with maps. In fig. 1 it is shown that agricultural activity, as the factor of negative impact, prevails, and the RDB-response index constitutes 17% here. Without exception, if data increase, the RDB-response index will be over 17%, because 72% of the territory of the country is used for agriculture. This is a vast territory, and in order to comprehend its size one can use RS data. For example, recently, a group of the ULRMC specialists, V. Prydatko, A. Ischuk, and Y. Stepa, has used the GIS and the modern map of agro-landscapes2 generated with the use of RS data [10] and made an attempt to match “point” habitats of the Red Data Book of Ukraine species (n>19000) with the map of agriculture surfaces (n>25000). According to new data, 45% of the “red data book” plant habitats and 47% of the “red data book” animal habitats (described in 1994-1996) overlap with contemporary agrosurfaces. In general, there is no other powerful mechanism of situation change for the better but further improving the land management and training the new land owners. Data source and process for updating The source of data is the Red Data Book of Ukraine (Flora and Fauna). The Cabinet of Ministers of Ukraine is responsible for the official publication and distribution of the Red Data Book of Ukraine not less than once per 10 years [9].  Closely related indicators It has not been studied yet.
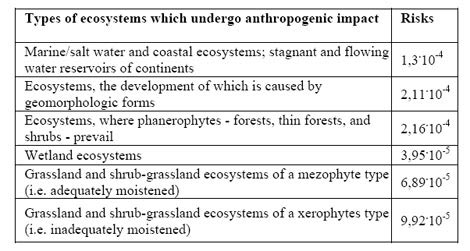
  Additional information and important comments The story of the Red Data Book of the former USSR started in 1978, and for this period the number of species included into it has increased essentially [5,6,7,8] – see Figure 2. This was caused both by the insufficient study of the state of biota (which may exist constantly) and by the growing anthropogenic pressure upon the living creatures habitats. At the same time, as some of the authors noted, there was a significant time lag while establishing the fact of the “red data book” species status: difference between the publication and the moment of species inclusion into the Red Data Book was 3-5 years, and therefore biodiversity management was of virtual character [11]. Based on the conducted study it was found out that most of plant and animal species disappeared or are endangered, first of all, because of ecological niches destruction, agriculture, and excessive mining [2]. According to other materials of the UIENR specialists’ publication [2], the risks of the state destruction of different types of ecosystems (excluding agro-ecosystems) due to increase in number of the “red data book species” are the following (Table).
  Additional sources of information 1. Загороднюк І.В. Систематичне положення таксону як критерій його вразливості/Доповіді НАН України. 2000. 2. Буравльов Є., Пньовська О., Коваль Г. Підхід до моніторингу антропогенного впливу на біорізноманіття/ Екологія і ресурси. Збірник наукових праць. Випуск 5. Київ, 2003, стор. 64-68. 3. Перспективи використання, збереження та відтворення агробіорізноманіття в Україні. (Відповідальні редактори акад.. УААН, проф. Патика В.П., д.б.н., проф.. Соломаха В.А.). Київ: “Хімджест”, 2003, 254 с. 4. Indicators and Environmental Impact Assessment. UNEP/CBD/SBSTTA/7/12, September 20, 2001, p.21. 5. Красная книга СССР. – М, 1978. 6. Червона книга України. – К, 1980. 7. Червона книга України. Тваринний світ – К, 1994. 8. Червона книга України. Рослинний світ – К, 1996. 9. Закон вiд 07.02.2002 № 3055-III Про Червону книгу України 10. Созинов А.А., Штепа Ю.Н, Придатко В.И. Агросфера, как объект целевого исследования с помощью ДЗЗ и ГИС для улучшения управления территориальным развитием и сохранения природного биоразнообразия / Ученые записки Таврического национального университета им. В.И.Вернадского, Серия «География», Том 17 (56), №2 (2004), с. 72-87 – http://www.ulrmc.org.ua/services/binu/publications/index_ua.html 11. V. Prydatko. Biodiversity and Bioresources of Ukraine: Review of SoE Publications (1992-1998). Re-evaluation of Trends (1966-1999). The Environment and Resources. ISBN 966-95141-1-6. Kyiv: ERRIU, 2000, pp.194-214. <http://www.ulrmc.org.ua/services/binu/publications/index.html>
Prepared by
Y. Buravlyov, O. Pnyovska, G. Koval (NSI), and V. Prydatko (ULRMC). English translation: Liudmyla Antoniak The source of information about the Indicator Fact Sheet: UNEP-WCMC Adapted by ULRMC for the purposes of work with agro-biodiversity indicators in the framework of the project UNEP-GEF BINU. More details can be found at the web site http://www.ulrmc.org.ua/services/binu/index_ua.html. The assessments and opinions of the author(s) do not always coincide with the official point of view of the Ministry of Environmental Resources of Ukraine, the Secretariat of Convention, UNEP, GEF, and other donors and implementing agencies.


1 Comment
Grigoriy Kolomytsev · Thursday November 29th, 2007 at 02:03 AM
Ua version already available