


 Beech: model of expected distribution in 2050 by GLM (forced by climate) . current potential distribution
  Differences in current distribution map and distribution (see please picture above), predicted by model (based on climatic requirements, modelled by GLM) are relatively significant. .
 The map shows expected changes in Beech (Fagus sylvatica) distribution to 2050 due to climate changes. Map visualize appearance of the climatic suitable territories for beech on east to 2050 (which is actually steppe and potentially can’t be acceptable for Fagus sylvatica survival by other options). Note please that not all of the predicted “potentially suitable” (by climate parameters) territory contain suitable habitats. Model is based on GLM methodology. Input climate data derived from IMAGE model, distribution map compiled based on Biodat maps. .
  .
.
Map authors: G.Kolomytsev, V.Prydatko Last update: June 09, 2008.
.  Beech (Fagus sylvatica L.) habitat changes modelling result demonstrates: i) possible enlargement (restoration) of the species natural habitats – Scenario #1, and ii) possible artificial enlargement of the habitats to the East ‘for cost’ of settlements i.e. its green zones (gardens, parks etc.) – in the GLOBIO Ukraine Region. See full animated story about trends: Fagus sylvatica L. areal changes were modelled with usage of GIS and RS data. GIS and RS data includes following. 1) Map of the USSR European Part Vegetation, M1:4,000, 000, drawn up by Prof. J.Kuznetsov (1928) – in Russian. The map was granted by the Vernadsky National Library (Kyiv) – vectorization made by V.Prydatko, A.Ischuk, Y.Apetova, A.Kalynychenko (ULRMC). 2) Vegetation of European Part of the USSR: Analytical Maps I-IX (Attachments)/Vegetation of European Part of the USSR. S.P., Nauka, 1980.—429 pp, in Russian.3) Fagus sylvatica/Distribution maps// The European Forest Genetic Resources Programme (EUFORGEN) – http://www.bioversityinternational.org/networks/euforgen/Euf_Distribution_Maps.asp 4) Atlas Florae Europaeae (1972-1996), edited by Jaakko Jalas and Juha Suominen, together with Raino Lampinen (Vol. 11)/Updated 2004-05-26 by Mikko Heikkinen – Website at http://www.fmnh.helsinki.fi/english/botany/afe/ – with our transformation of the data to a buffer zone, which intersected a remote sensing data i.e. ‘5 and ‘6’ sources of the information. 5) Ukraine Forest in 1990s based on Landsat Data (ULRMC, 2005). 6) Ukraine Forest in 2000s based on Landsat Data (ULRMC, 2005). The historical map of 80s was scanned, processed and digitized in ArcGIS by V.Prydatko. For the first time in GLOBIO Ukraine Region the GIS analyse was used for calculation of total beech coverage based on historical maps and new remote sensing data.- Table 1 (by request). It provs that EUFORGEN spatial data [3] can be mistaken because of abnormal 320% enlargement of expected beech natural habitats coverage in the rergion: it was six times bigger contrary to 30-m-resolution RS data of 2000s i.e. forest coverage. Scenario 1 takes into account possible presence of the species inside of its natural zones only. The AFE [4] and EUFORGEN [3] data reflects its transformation to a new shape based on intersection of the data with Landsat (i.e forest land cover class) of 1990s and 2000s. Scenario 2 takes into account possible presence of the species: i) inside of its natural zones, ii) and outside i.e in settlements also (that is based on GSF Index). The AFE [4] and EUFORGEN [4] data reflects its transformation to a new shape based on intersection of the data with Landsat (i.e forest land cover class) of 1990s and 2000s. The main causes of change are not interpreted definitely, but it can be land use (deciduous forest fragmentation), and possibly climate change. The example is a step to GLM-model. GIS map authors: V.Prydatko (ULRMC), G.Kolomytsev (IZ NASU). Last update: June 5, 2008. . EP Support
 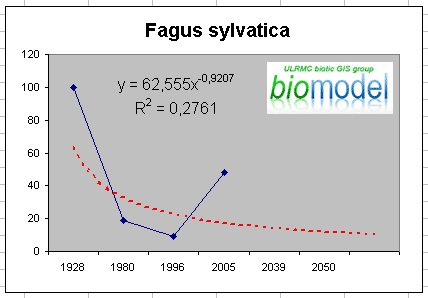 Scenario #1 – supportive power approximation showed that the species natural habitats would be more sustainable in the nearest future i.e before 2030 contrary to present. There is no special statistics about total of the habitats in the Project Area, which includes Ukraine, Belarus, Moldova. Nevertheless BioModel’s result is based on GIS-calculation of realistic area of the species with further transformation of it to points (0…100). Preperad by: V.Prydatko, O.Savchenko (ULRMC).