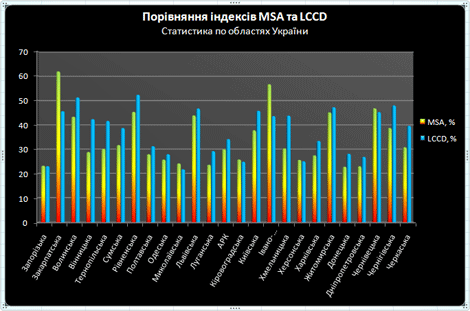
Доступно сравнение средних значений индексов по областям Украины:  . В добавок, Вы можете сравнить индикативные карты LCCD (LCCD_bio) и MSA в одинаковой цветовой схеме:

Categories: Тренинг-Пакет Биоразнообразие
Доступно сравнение средних значений индексов по областям Украины:  . В добавок, Вы можете сравнить индикативные карты LCCD (LCCD_bio) и MSA в одинаковой цветовой схеме:

1 Comment
Vasyl Prydatko · среда марта 5th, 2008 at 02:07 PM
I.e. MSA model (1 sq.km per grid), and
Ukraine LCCD_Bio model (0,0025 sq.km per grid).