


HABITAT CHANGES TREND: AMPLITUDE OF CHANGES BASED ON RS-GIS DATA (RS-GIS-INDEX) Use and Interpretation
Users and potential users, the key questions for which the indicator/index is intended (if appropriate, comment on whether it is an impact, pressure, state or response indicator, recognizing that one indicator/index may fill several roles in this respect)
 This indicator (index) is new for Ukraine (V.P. – RS and GIS application in estimating habitats state (mosaicism, area etc.) is not new in ecological studies. There are lot of publications related to this topic, especially foreign ones. At the same time, we have not found any summary on this topic in national publications which would correspond to the defined objective. The proposed RS-GIS-index (the abbreviation is initial) has powerful resumptive capacity, and in our case, it is a package of more than 22 indicators. The RS-GIS-index statistical capacity has not been studied yet, so the proposed capacity research, as well as graphic interpretation of results, is initial). That is why today potential users are represented by, first of all, recipients of the UNEP-GEF Project “Biodiversity Indicators for National Use” (BINU), and other scientific institutions, for instance, the NASU or UAAS network, educational institutions, in particular, NaUKMA, environmental organizations, the national office for communications with the Secretariat of the Convention on Biological Diversity etc. The three key questions which this indicator helps to answer are: “What are the main factors that cause agrobiodiversity loss or increase, and how do changes in the land use practices influence agrobiodiversity loss or increase?”, “How can scenarios of agro-biodiversity changes be built, and how can
  biodiversity loss be stopped in the near future?”, and “What is the current state of agrobiodiversity in Ukraine?” We refer it to indicators/indices of state (S). Obviously, it is also a response indicator (R), in terms that it shows how land use changes have influenced or influence biodiversity through surface area changes of different biotopes. The research is our input into development of priority indicators to achieve the 2010 target (The 2010 target was declared by the member-countries of the Convention on Biodiversity in 2002 in Hague, the Netherlands, and it implies successful diminution of biodiversity losses rates till 2010. The list of indicators to be immediately developed for today includes in particular, Trends in extent of selected biomes, ecosystems, and habitats, Trends in abundance and distribution of selected species, Coverage of protected areas. The direction is actively developed. For example, in August 2005, we stated more than 49,000 references on the Internet after entering the 2010-target).
Scale of appropriate use and potential for aggregation
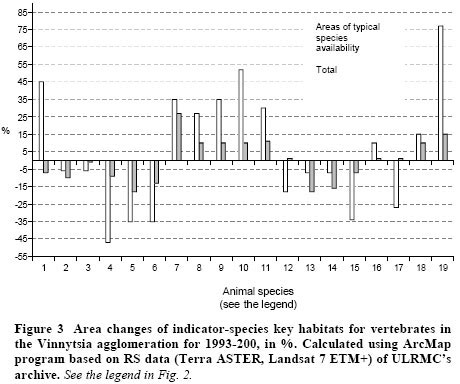
The entire territory of Ukraine and/or natural agricultural areas, agro-landscape types, other territories, including, most of all, built-up area. In our special research, they are represented by city agglomeration areas (by the example of Kyiv and Vinnytsia). Meaning and potential causes of upward and downward trends. The RS-GIS-index has not been applied in Ukraine to date. It may play an important subsidiary role in calculating the simplest classical biodiversity index, for example, according to E.Odum etc. [1], as it contains the information on habitats area in its input data library. It is a contribution to implementing the VII/30 decision of the Parties to the Convention on Biodiversity – this is concerning the development of indicators to achieve the 2010 target, since the index operates directly with habitat areas, and that is why it has supplementary advantages in comparison to indirect action indicators [2.3, see also a particular article in the same study]. At the same time, it is an index for estimating “pressure” on habitats with a possibility of results comparative interspecific interpretation (Fig. 1, Fig. 2), including using a thematic map. The index information value is beyond studying agrobiodiversity and is also related to the state of mega-ecosystems biodiversity. The RS-GIS-index proves that, in particular, due to land use changes the generalized amplitude of habitat changes for wild animal species comprised from (-27%) up to (+28%), and which happened for 7-13 research years and based on 20 bird species examples and 2 mammal species of two powerful city agglomerations with the totalarea of up to 2 thousand sq. km. Calculated rates for biodiversity loss made up tentatively 0.08% per year in Kyiv, and 0.14% in Vinnytsia agglomerations. There was a considerable decrease in habitat areas for open landscape birds (Alauda arvensis L., Galerida cristata (L.)), as well as border forest and lawn birds (Emberiza citrinella L., Lanius collurio L.).
Implications for biodiversity management
The UNEP/CBD/SBSTTA/7/12 document of the Subsidiary Body on Scientific, Technical and Technological Advice (SBSTTA) of the Convention on Biodiversity does not have exactly such “indicators” as birds and mammals specified independently. At the same time, according to survey results there was estimated that up to 18% countries use agrobiodiversity as an indicator, in particular, Number of species threatened by agriculture by group (e.g. birds, mammals, vascular plants, vertebrates, invertebrates). Other combined indicators include the following: Species richness (number, number per unit area, number per habitat area), – 50%, Diversity of native fauna – 54%, Change in habitat boundaries – 36%, Change in number and/or distribution of keystone or indicator species – 32%, Existence of procedures for identifying endangered, rare, and threatened species – 43%. Units in which it is expressed (for example, km2, number of individuals, % change) In our case, this is percentage of a habitat area (Δ Y1,Y2) which has been changed for a time period (t Y1,Y2), and generalization related to such change in the form of the changes amplitude (Δ Y1,Y2 Min…Δ Y1,Y2 Max), as well as graphic interpretation of the variation represented by a two-pole diagram related to the OY line (Fig. 1, 2). Current results of particular species and their biotopes calculations have also, for sure, indicative meaning – this is in square kilometers (sq. km) and/or hectares (ha). The generalized change may also be represented directly by a classical index of biodiversity (d), see below. Description of source data (origins, units, sample size and extent, custodians) Input data are always represented by field surveys data on indicator-species habitats combined with RS materials of medium and high resolution placed in an adapted for this GIS [2]. (In our study, we had data obtained, in particular, from the Landsat 4 TM, Terra ASTER, and Terra MODIS satellites.) Calculation procedure (including appropriate methods and constraints for aggregation) The calculation process is represented in a particular publication [4]. The required software shall obligatory include ArcGIS 9.x, ERDAS IMAGINE 8.x. Most effective forms of presentation (graph types, maps, narratives, etc. – give examples if possible) The RS-GIS-index may be represented by one exponent (Δ Y1,Y2 Min…Δ Y1,Y2 Max, see above): that is in the form of the habitat area changes amplitude, and which is a result of studying a ranged set of changes demonstrated through predetermined species-indicators of the researched area, dimension of which is selected experimentally. (In our case, there were selected 20 bird species, 2 mammal species, 2 oblast and rayon city agglomerations united into one researched area of up to 2 thousand sq. km). Intermediate results may be represented as a complete ranged set – this is in the form of a two-pole diagram (Fig. 1). Earlier, we have demonstrated images of current generalizations for the Kyiv and Vinnytsia agglomerations – this is in the form of two-pole diagrams which showed absolute values related to the changed areas – in square kilometers or hectares [4, see the collected articles]. Optionally, based on our studies results using GIS a package of thematic maps can be generated [4], as well as both the classical index of biodiversity (d±Δ), and its change tentative rates per year can be calculated – see below. Extraction of information on changes related to agro-ecosystems is also possible. In such case, only biotopes status should be analyzed, which in our classifier [see 4] are described as “Agrolandscapes”, “Rural Built-Up Area, Parks”, “Forest Borders and Lawns” (We remind that this classifier considers the possibility of biotopes distant identification in the area using satellite images). We consider that demonstration of the changes amplitude is a more convenient and understandable form for results presentation rather than calculation of the biodiversity index, when the matter concerns compiling annual national reports on biodiversity. Another form for presenting results may be applied as well [4], but it is, in our opinion, tedious and does not provide such significant benefits as quick perception of results by decision-makers (Fig.2). Data sources and process for updating There is no single information source. In fact, it is a set of scientific publications and/or scientific reports, in particular, at the level of the Institute of Zoology under the NASU, the Institute of Botany under the NASU etc., which represent one indicator in a special statistic study. In our case, we used Taras Shevchenko Kyiv National University .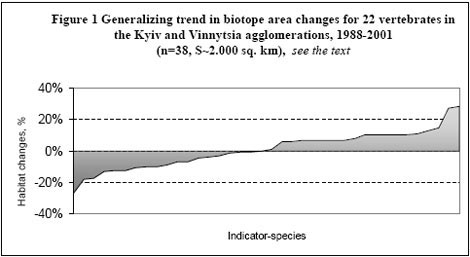 Closely related indicators LPI, Species richness (number, number per unit area, number per habitat area), Diversity of native fauna, and other indicators related to diversity by species groups. See also the subsection “Implications for biodiversity management”.
Additional information and important comments
We believe, the development of the index completely meets the objective of the most rapid development of indicators to support the 2010 target action aimed at looking for ways to slow down biodiversity losses rates. For instance, besides the variation amplitude related to habitat area changes, the input data allow also finding out the response to the question about Species richness (number, number per unit area, number per habitat area) related to the 2010 target. For the Ukrainian conditions, in our statistical experiment, calculation of the d±Δ biodiversity index is performed using the known formula d=S/logA, where S – species number, A – calculation area, Δ- method error (Proposed by us, but not investigated in the stated example). Since, the number of indicator-species was constant in the calculation area during the whole research period, we consider this value to be a constant for the experiment (Sconst=22). As a result, we have the reduced biodiversity index (d) for the Kyiv agglomeration for 13 years due to land use changes, and, respectively, changes of indicator-species habitat areas; in comparison to the baseline year, it dropped from 6.881 to 6.876, that is it became 99.93%. The same we can observe in the Vinnytsia agglomeration for 7 years: 7.449 – 7.442 and 99.91%, respectively. Thus, the calculated biodiversity loss rates comprised tentatively 0.08%/per year in the Kyiv, and 0.14%/per year in the Vinnytsia agglomerations. Based on officials’ needs, we assume that the generalized amplitude of habitat changes (RS-GIS-іndex) illustrates in the most vivid and understandable way the state of things, rather than the classical biodiversity index (d). For sure, this event related to consequences of impressive manual intrusion into the nature contradicts to both the sustainable development concept and the concept of 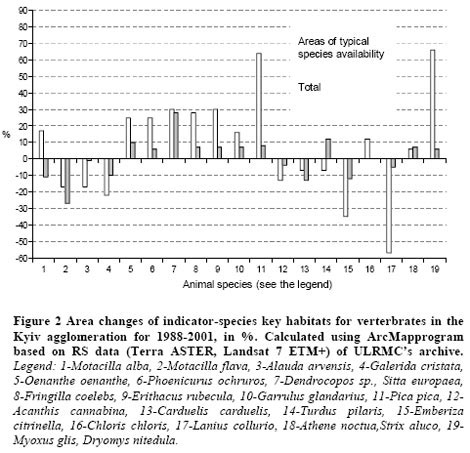 [ Area changes of indicator-species key habitats for vertebrates in the Kyiv agglomeration for 1988-2001, in %. Calculated using ArcMap program based on RS data (Terra ASTER, Landsat 7 ETM+) of ULRMC-s archive. Legend 1-Motacilla alba, 2-Motacilla flava, 3-Alauda arvensis, 4-Galerida cristata, 5-Oenanthe oenanthe, 6-Phoenicurus ochruros, 7-Dendrocopos sp., Sitta europaea, 8-Fringilla coelebs, 9-Erithacus rubecula, 10-Garrulus glandarius, 11-Pica pica, 12-Acanthis cannabina, 13-Carduelis carduelis, 14-Turdus pilaris, 15-Emberiza citrinella, 16-Chloris chloris, 17-Lanius collurio, 18-Athene noctua, Strix aluco, 19-Myoxus glis, Dryomys nitedula. ] friendly for nature management. One thing unknown is what artificially represented amplitude shall be in order not to leave the situation out of control. This issue needs urgent consideration.
Additional sources of information
1. Протасов А. Биоразнообразие и его оценка. Концептуальная диверсикология. Киев, 2002, 106 с. 2. Searchable List of Indicators – www.ulrmc.org.ua/services/binu/is/index.asp?lang=EN 3. 1st Ukrainian BINU Project Report: Agro-biodiversity Indicators for National Use (January 2003-September 2003). Presented to UNEP-World Conservation Monitoring Centre (UNEP-WCMC) under Agreement for the Supply of Services for the Period January 1 – September 30, 2003. Prepared by Dr. Vasyl Prydatko et al. www.ulrmc.org.ua/services/binu/publications/index.html. 4. Коломицев Г.О., Придатко В.І., Лопарьов С.О. Використання даних космозйомки Terra (ASTER) та Landsat 4 TM для інвентаризації середовищ існування птахів агроландшафтів на прикладі м. Києва (1988-2001 рр.) /Агробіорізноманіття України: теорія, методологія, індикатори, приклади. Книга 1. – Київ: ЗАТ «Нічлава», 2005, с. 177-185. P
Prepared by
V.Prydatko (ULRMC), H. Kolomytsev (KNU) Translated from Ukrainian into English by Olena Prokopchuk Agrobiodiversity of Ukraine: Theory, Methodology, Indicators, Examples. Book 2. – Kyiv: CJSC “Nichlava”. 2005. pp.450-457.